Glycome Graph help
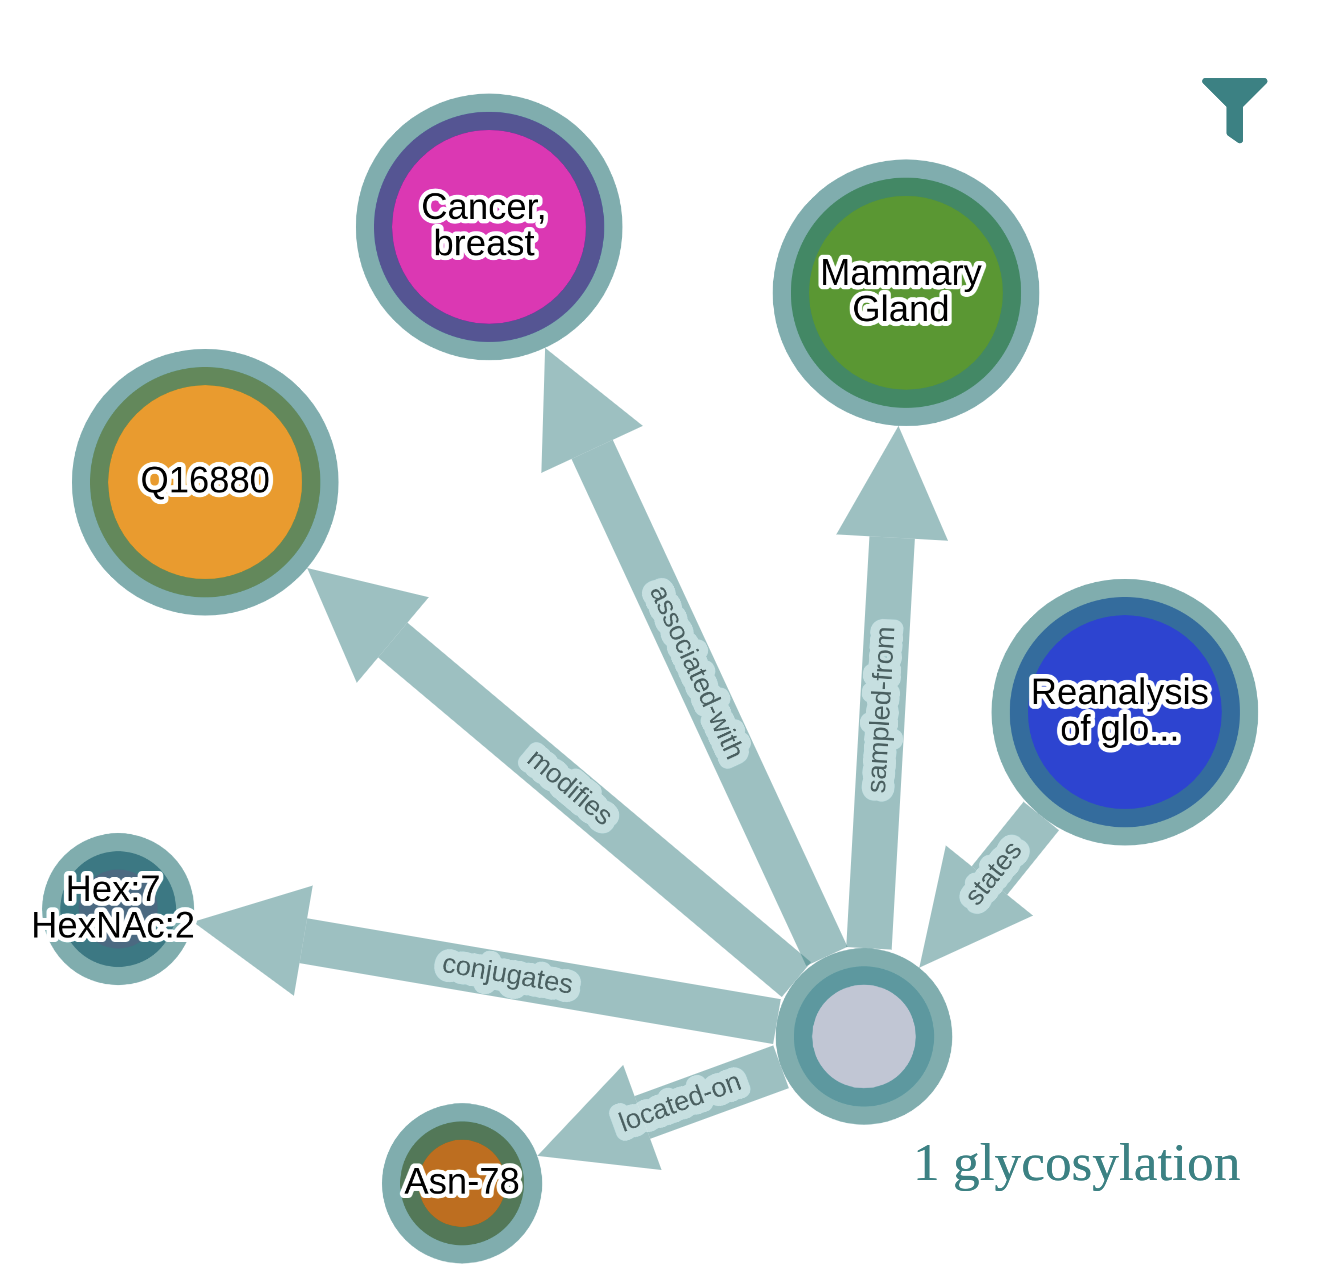
The graph captures all the protein glycosylations found in a selection of scientific publications. A Glycosylation is represented by a maximum of 5 properties describing this event such as:
- the Protein that is modified (mandatory)
- the Glycan covalently added to the protein (mandatory)
- the protein amino-acid Site that is modified
- the Biological source of the glycoprotein (tissue + organism)
- the Disease status of the biological source
with 2 types of relation:
- a scientific publication that cites a glycosylation
- a glycosylation defined by one of the 5 properties seen above
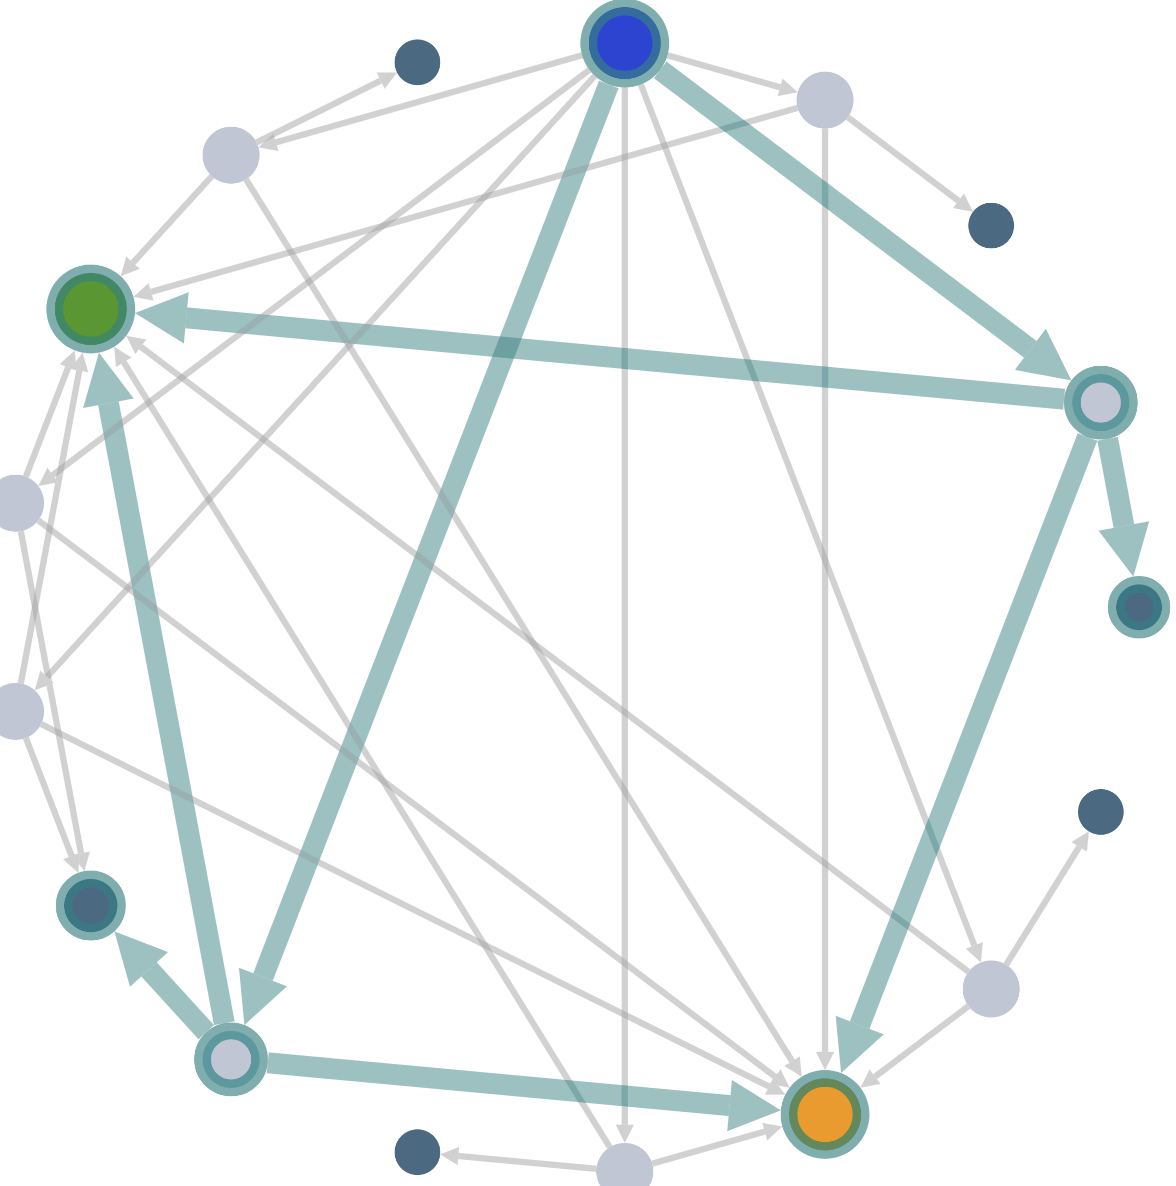
Example:
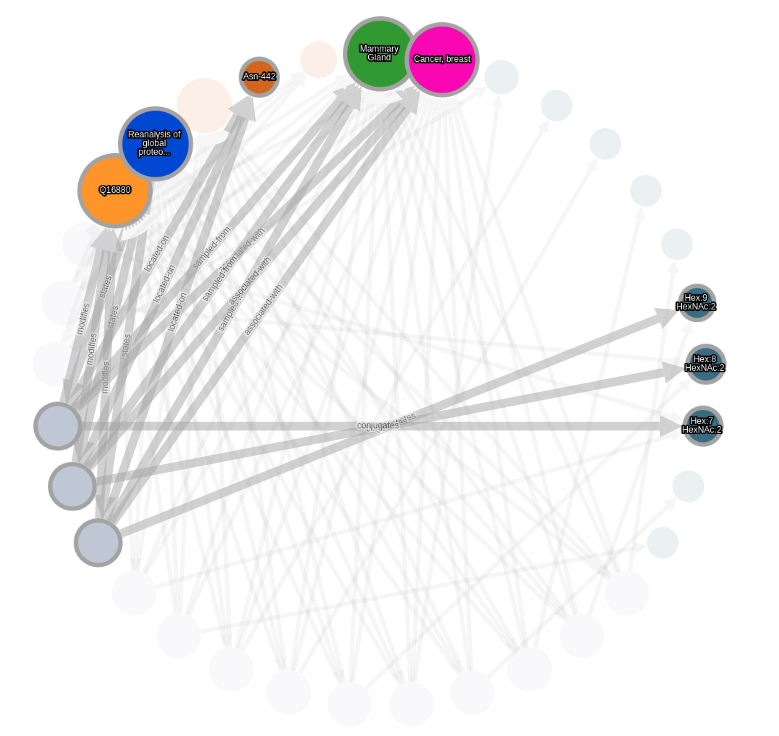
Graph layout
A layout involves the arrangement of nodes and edges within a graph, aiming for a visually coherent and logical presentation. You can manually arrange the layout by dragging and dropping nodes or you can opt for automatic layout. Select the layout of your choice in the top right dropdown box.
![]()
This arrangement only affects the selected area of the graph if applicable.
| Layout | Description |
|---|---|
| Circular | Organise the nodes on a circle |
| Circular (avsvf) | Organise the nodes on a circle (Adjacent Vertex with Smallest Degree First algorithm ) |
| Circular (hierarchy) | Organise the nodes on multi-level concentric circles |
| Grid | Organise the nodes in a well-spaced grid. The nodes are placed from left to right and top to bottom, sorted by node type |
| Grid (hierarchy) | Organise the nodes in a top-down grid hierarchy |
| Organic (cola) | Sets node positions over several iterations through a force-directed algorithm. Each iteration sets a new node position, creating a natural animation effect (WebCola algorithm) |
| Organic (CoSE) | Same as above (Compound Spring Embedder algorithm) |
| Radial | Arrange nodes in concentric circles according to a closeness centrality index that measures its average farness (inverse distance) to all other nodes (the higher the score the closer to other nodes) |
| Radial (hierarchy) | Same as above (with a top-down level organization) |
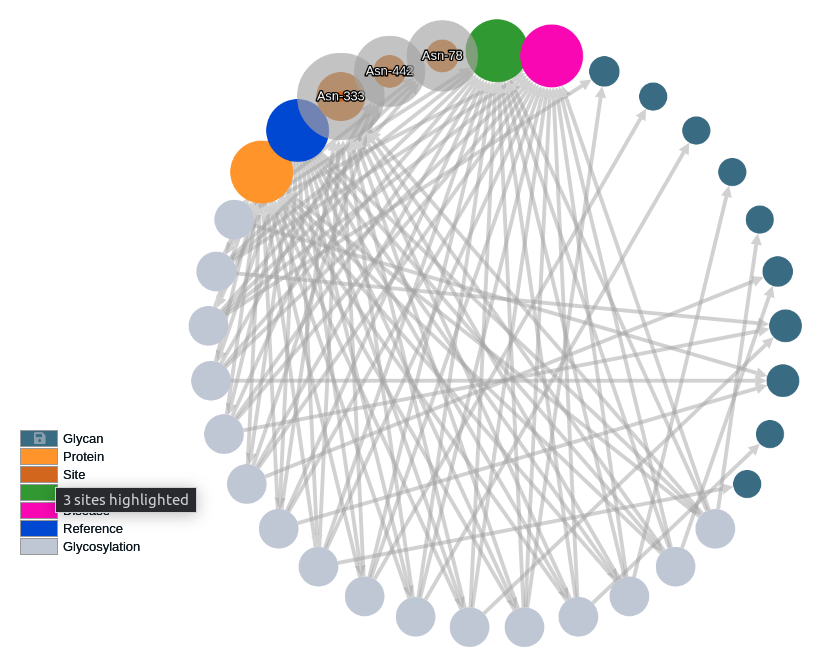
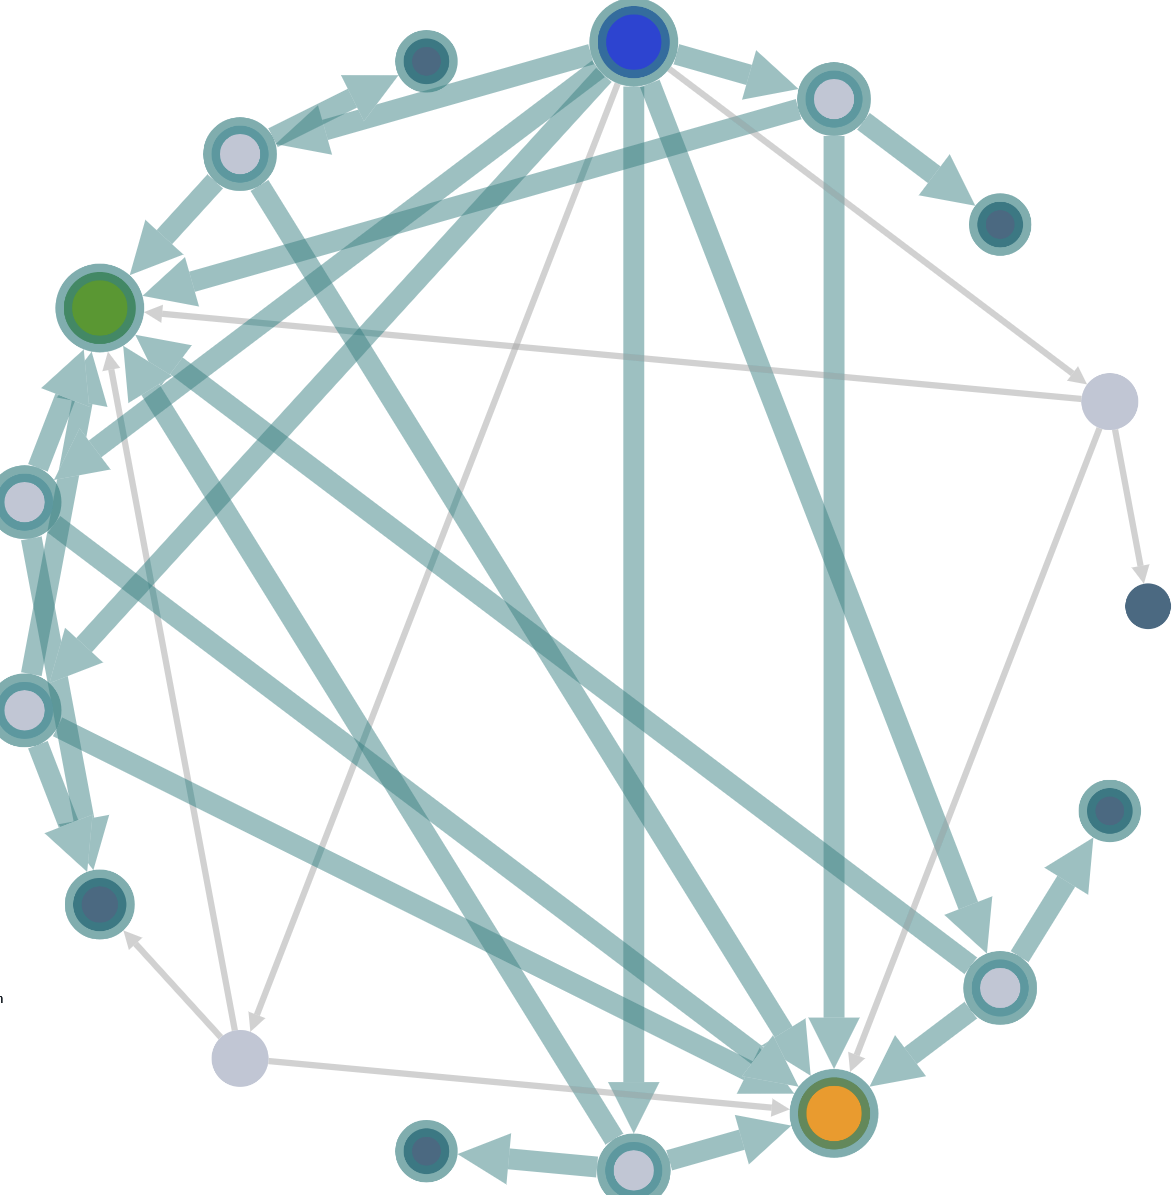
Highlight nodes and graphs
Mouse over the graph elements to highlight the connected glycosylation events.
Mouse over a node legend to highlight the nodes of this type in the selected graph.
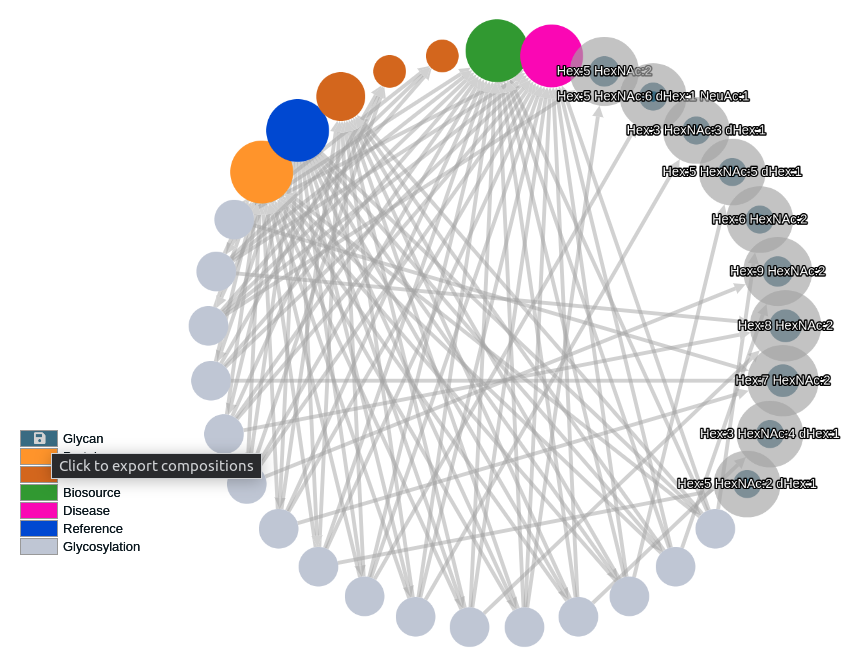
Click the export icon in glycan legend to generate an export of the selected glycans' composition list.
Open entries
Mouse over any node and do a left click + Alt (or ⌥ for Mac user) to open the GlyConnect entry in a new tab.
Copy/paste
Node content can be copied from the graph and pasted into the search text field. Hovering over a node displays its content.
Search glycosylations
Click to create a subquery.
Choose a category and an operator then start typing in the provided field to perform an incremental search on nodes.
Then type on Search to find the glycosylations that share the glycans common to all subqueries.
Click Search / ( current filter) to resp. visualize the nodes or
add the glycosylations matching the query to the current filter.
Filter glycosylations
Build filters and pick one to highlight the selected glycosylations in the graph.
Create filters
Click to create a new empty filter.
![]()
Click to create a duplicated filter.
![]()
Click to create a filter containing the glycosylations sharing the glycans common to all selected filters.
Filter glycosylations
You can include Glycosylations in the active filter by left-clicking on nodes, or exclude them by right-clicking. Alternatively, you can manage this through the Search feature located above.
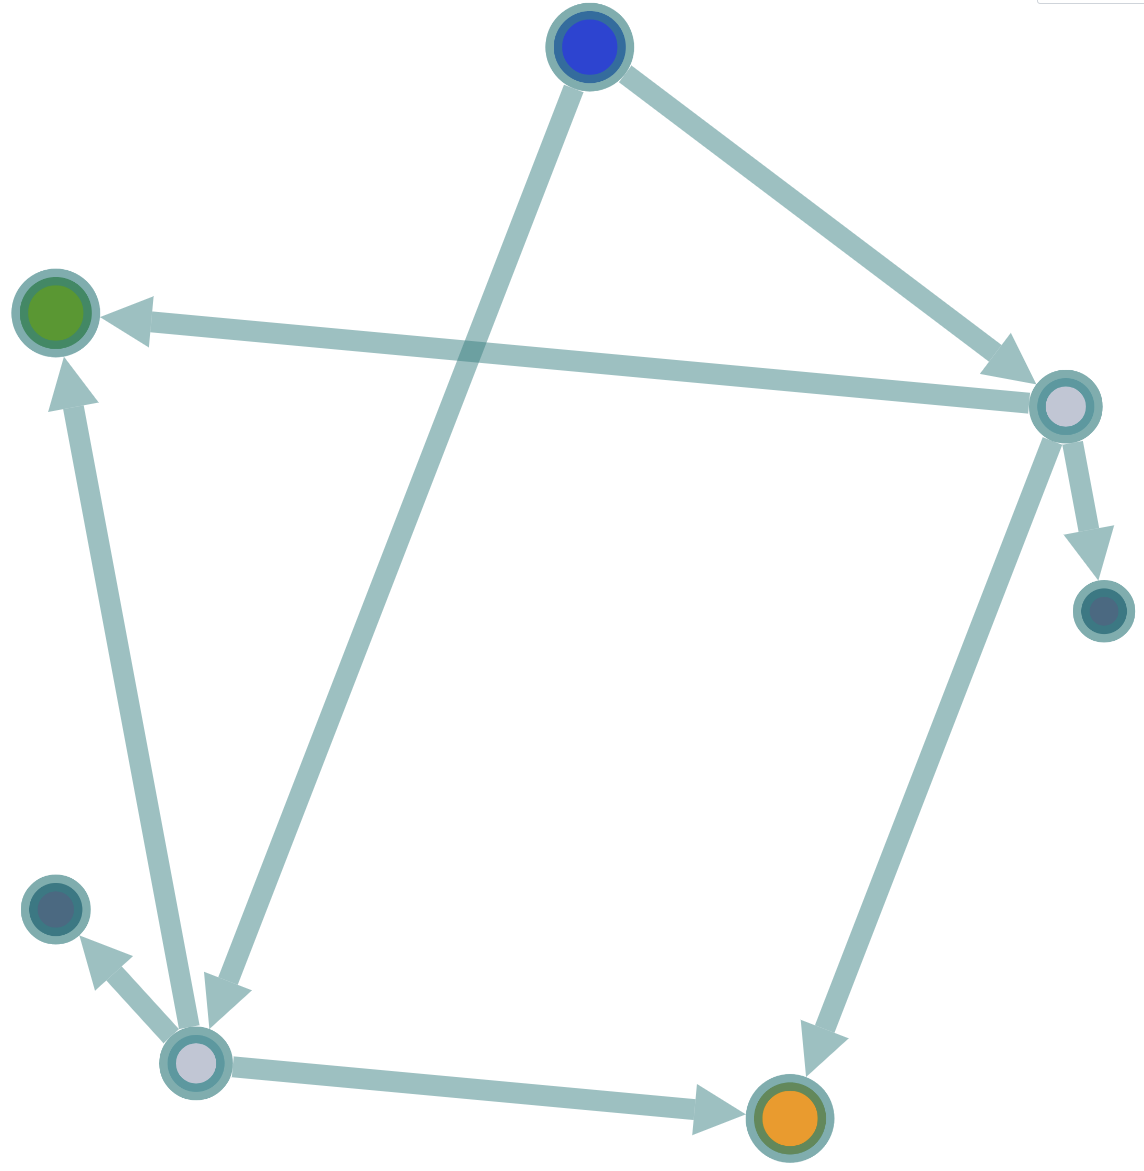
Highlight filtered glycosylations
First select a filter to highlight the filtered glycosylations in the graph.
![]()
then click to display the selection only.
![]()
You can also filter the complement of the selection by clicking .
![]()
then click to display the selection only.
![]()
Transition to delete mode
Click resp.
in Search or Filter module to activate the delete mode.
In this mode, you have the option to remove table rows.
Screenshot graph
Make a screenshot of the presently selected graph in PNG or SVG while preserving the exact node positions (and optionally their size).
Save/load graph
Save your session in a JSON file by clicking on (the current graph and the filters will be stored).
Browse to choose a JSON file and load its content by clicking on .